
Top 10 Earnings Calendar Platforms Every Investor Should Know in 2026

PAGE
By PAGE Editor
Introduction
Earnings season sets the tempo of the market. A single quarterly release can move a stock 10–20% in after-hours trading, reset analyst models, and reshape sector sentiment overnight. For anyone holding equities — from a retail investor with a five-name watchlist to an advisor managing hundreds of client accounts — knowing exactly when a company reports and having fast access to the numbers, the call, and the filings is a baseline requirement.
The tools built around this need have diverged sharply over the past few years. Some platforms are lean scheduling pages. Others bundle AI-generated call summaries, transcript translation, options analytics, or crowdsourced estimates. Free tiers exist alongside $299/month advisor products, and the right pick depends heavily on whether you're an options trader, a fundamental analyst, or a long-term investor who mostly wants to know when to pay attention.
This guide reviews ten platforms in active use in 2026, comparing coverage, features, pricing, and ideal use cases so you can match a tool to your actual workflow.
How We Test
Each platform was evaluated across five dimensions using the same rubric:
Coverage depth — number of tickers tracked, historical data range, and international market support
Calendar functionality — filtering, watchlist integration, EPS/revenue previews, and pre- vs. post-market labeling
Supporting research tools — transcripts, AI summaries, SEC filings, options analytics, alerts
Pricing transparency — free tier value, monthly/annual pricing, refund policies, and hidden add-on costs
User experience — interface clarity, mobile support, and multi-device sync
Feature and pricing details were drawn from each platform's official documentation.
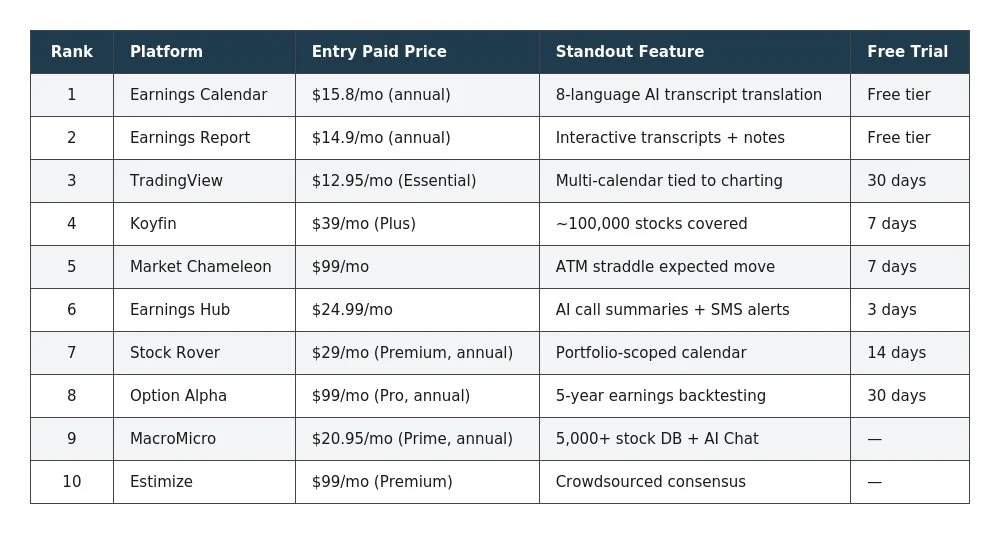
TL;DR Comparison Table
The 10 Platforms
1. Earnings Calendar
Earnings Calendar positions itself as a research workspace rather than a plain scheduling page. The core idea is to take an earnings date and connect it directly to source evidence — the live audio, the interactive transcript, the SEC filing, and the raw slide deck — inside one interface. Coverage extends to thousands of U.S.-listed tickers, and the historical data reaches back roughly 20 years for names like NVDA and AAPL, which makes it usable for both same-day event tracking and multi-cycle trend research. The platform is aimed at retail investors and independent analysts who read transcripts closely and want translation, notes, and audio replay in one place instead of stitching several tools together.
Core capabilities
Real-time earnings feed covering pre-market and post-market releases with instant EPS, revenue, and price updates
Day, week, and month calendar views searchable by ticker or company name
Personalized watchlist workspace with inline private notes
Live earnings call audio and on-demand replays of archived calls
Interactive transcripts with timestamp jump-to-audio and inline highlighting
AI translation into 8 languages: Simplified Chinese, Traditional Chinese, Japanese, Korean, German, French, Spanish, and Portuguese
~20 years of quarterly EPS and revenue history for thousands of tickers
Direct access to 10-K, 10-Q, and 8-K filings with condensed summaries and lossless downloads
Real-time keyword and theme tracking with push notifications when set terms appear in transcripts
One-click export of investor decks, quarterly slides, and PDFs
Plans and pricing
Free — $0/month, 3 monthly research credits, basic calendar access
Plus — $15.8/month (billed annually at $190, ~17% savings), 300 credits, transcript translation, keyword monitoring, notes
Pro — $40.8/month (billed annually at $490), 650 credits, priority workflow and support
Checkout runs through FastPay and subscriptions can be cancelled at any time.
Strengths
Combines audio, text, timestamps, and notes in a single transcript workspace
8-language translation coverage is unusually broad for a retail-priced tool
~20 years of historical EPS/revenue supports long-range research
Free tier is usable for occasional lookups without a credit card
Limitations
Credit system requires planning during translation-heavy months
No built-in options analytics or Greeks module
Best for: International retail investors and independent analysts who work heavily with earnings call transcripts and want translation, note-taking, and filings in the same workspace.
2. Earnings Report
Earnings Report takes a similar calendar-to-source-evidence approach and pairs it with lower entry pricing on the paid tiers. The platform tracks thousands of U.S.-listed companies with nearly two decades of quarterly EPS and revenue history, and its interface is built around the idea that most investors care as much about what was said in a report as when it was released. Live audio, interactive transcripts, and 10-K/10-Q/8-K filings sit next to the calendar itself, and translation coverage matches the higher-priced peer above. It tends to attract cost-conscious retail investors and small research teams who want a transcript-heavy workflow across a moderate watchlist rather than an institutional-scale universe.
Core capabilities
Real-time earnings calendar with same-day pre-market and post-market EPS, revenue, and price updates
Week and month release schedules, searchable by ticker or company name
Personalized watchlist calendar with private notes for cross-transcript topic tracking
Live earnings call streaming and archived replay
Interactive transcripts with timestamp navigation and inline highlighting
AI transcript translation into the same 8 languages (Chinese Simplified/Traditional, Japanese, Korean, German, French, Spanish, Portuguese)
Nearly two decades of quarterly EPS and revenue history for thousands of tickers
10-K, 10-Q, and 8-K filings with condensed summaries and lossless downloads for AI model input
Real-time keyword and topic alerts across live transcripts
One-click download of investor decks, quarterly slides, and PDFs
Plans and pricing
Free — $0/month, 3 research credits, basic calendar access
Plus — $14.9/month (billed annually at $178.80, ~22% savings), 300 credits, translation, keyword monitoring, notes
Pro — $24.9/month (billed annually at $298.80, ~14% savings), 650 credits, priority workflow and support
Payments run through FastPay with cancel-anytime terms.
Strengths
Pro plan is noticeably cheaper than most transcript-focused competitors at $24.9/month annualized
Same 8-language translation coverage as higher-priced tools
Inline note-taking directly inside transcripts
No credit card required for the free tier
Limitations
3 free credits cap translation testing before an upgrade
No options analytics or volatility modeling
Best for: Cost-conscious retail investors who want a transcript- and filings-heavy workflow across a moderate watchlist rather than the whole market.
3. TradingView
TradingView is one of the most widely used charting and social platforms in retail investing, with tens of millions of active users. Its earnings calendar isn't a standalone product — it's a tab inside a much larger analytics ecosystem that also covers economic events, dividends, and IPOs. Where TradingView differentiates on the calendar side is integration: an upcoming report sits one click away from a multi-year price chart, 400+ built-in indicators, Pine Script backtesting, and paper trading. Coverage is global, and the free tier is genuinely usable for casual investors, which is why chart-driven traders often use TradingView as their default entry point into earnings-week planning.
Core capabilities
Earnings calendar with forecast vs. actual EPS and revenue, plus Surprise %
Click-sort on any financial metric for instant re-ranking
Filters for time period, country/region, and time zone
One-click switching between Earnings, Economic, Dividend, and IPO calendars
Individual company pages link to multi-quarter financial history
Supercharts with up to 21 chart types and up to 16 charts per tab (Ultimate)
400+ built-in indicators and 100,000+ community-built indicators
Pine Script® for custom indicators and deep backtesting with CSV/XLSX export
Up to 1,000 active price alerts with webhook delivery
Up to 7 portfolios × 150 positions × 5,000 transactions
Paper trading and direct broker integration
Full sync across web, desktop, iOS, and Android
Plans and pricing
Basic — Free, 1 chart/tab, 3 price alerts, 5K historical bars
Essential — $12.95/month annual, 5 indicators/chart, 20 price alerts
Plus — $29.95/month annual, 10 indicators/chart, 100 price + 100 technical alerts
Premium — $59.95/month annual, 25 indicators/chart, 400 alerts, second-based intervals
Ultimate — $199.95/month annual, 50 indicators/chart, 1,000 alerts, 7-day tick-level data
Essential, Plus, and Premium include 30-day trials; Ultimate offers 14 days. Only annual plans qualify for refunds within 14 days.
Strengths
Best-in-class charting alongside earnings dates for pre/post-release technical setups
Free tier is one of the most capable on this list
Multi-calendar switching cuts down on tab clutter
Huge community indicator ecosystem
Limitations
Earnings calendar is a supporting feature rather than a dedicated workspace
Monthly plans and exchange market data purchases are non-refundable
Real-time NASDAQ, NYSE, and CME data is a paid add-on
Best for: Chart-driven traders who want earnings dates on the same screen as technical analysis.
4. Koyfin
Koyfin is a research platform aimed at investors who want institutional-grade data at retail pricing, and it has become popular among fundamental analysts, RIAs, and hedge-fund associates who don't have Bloomberg budgets. On the earnings side, its calendar covers roughly 100,000 stocks globally — the widest reach on this list — and each entry links directly to detailed estimates, actuals-vs.-consensus comparisons, and earnings call transcripts. Beyond earnings, Koyfin bundles macro dashboards, screeners, portfolio analytics, and up to 10 years of historical financials plus 10 years of forward estimates. The 30-day money-back guarantee is unusually generous for the segment and lowers the risk of committing to an annual plan.
Core capabilities
Earnings calendar covering roughly 100,000 stocks globally
Detailed estimates beyond EPS and revenue, with hide/show controls per series
Automatic actuals-vs.-consensus comparison with surprise/miss calculation
Universe filtering by index (e.g., Russell 2000), ETF constituents, or personal watchlist
Direct links from calendar entries to earnings call transcripts
Global economic calendar filterable by date and country, with historical trend widgets
Advanced charting, macro dashboards, screeners, and portfolio analytics
7-day Pro trial requires no credit card
Plans and pricing
Free — 2-year historical financials, 1-year forward estimates, capped at 2 watchlists/screeners/dashboards
Plus — $39/month, 10-year historicals + 10-year forwards, 100K+ company snapshots, unlimited watchlists
Premium — $79/month, portfolio advanced analytics, unlimited custom formulas, U.S. ETF valuation
Advisor Core — $209/month, model portfolios, 1 custodian integration
Advisor Pro — $299/month, multi-custodian, up to 200 client reports/month
Annual billing saves up to 30%, and every paid plan carries a 30-day money-back guarantee.
Strengths
Global coverage (~100,000 tickers) is unmatched among mid-priced tools
30-day refund window is one of the most generous in this comparison
Small-firm discount available for advisors managing under $100M AUM
Estimate depth and transcript links serve fundamental research well
Limitations
Full mutual fund data is locked to Advisor tiers only
Interface has a learning curve if you're moving from simpler tools
Best for: Fundamental investors and advisors who need global earnings coverage plus deep estimate data in one place.
5. Market Chameleon
Market Chameleon is a specialized stock and options analytics platform that treats the earnings calendar as an options-pricing signal rather than a plain date list. The most distinctive feature is the Expected % Move column, derived from ATM straddle implied value — a direct read on what options traders are pricing in ahead of each release. Around that, the platform layers unusual option volume screens, IV rank tools, historical straddle performance data, and a full set of options strategy screeners (spreads, covered calls, iron condors, straddles, calendars, butterflies). The free tier is unusually feature-rich for the category, and the paid Total Access plan at $99/month is aimed squarely at traders who structure positions around earnings volatility.
Core capabilities
Free stock earnings calendar with filter, search, and sort for upcoming and historical dates
Expected % Move derived from ATM straddle implied value
BMO (before market open) vs. AMC (after market close) tags
Premarket, after-hours, opening auction, and closing auction data
Market movers: 52-week highs/lows, S&P 500 volume burst trades, order imbalances, unusual volume
Unusual option volume, IV rank, and put protection screens
Premium earnings tools: guidance reports, implied move charts, historical straddle performance, earnings option strategy screener
Options strategy screeners: bull/bear call and put spreads, covered calls, naked puts, calendars, butterflies, iron condors, straddles
Catalyst tracking: biotech catalysts, PDUFA dates, M&A, zero-DTE straddles
Plans and pricing
Free/Starter — $0, basic earnings calendar and options screening
Total Access (Premium) — $99/month with a 7-day free trial
Trial users get 2 downloads per rolling 24 hours; paid subscribers get 25. A credit card is required for trial and billing starts automatically on day 8 unless cancelled.
Strengths
Expected % Move from ATM straddles is a genuinely useful pre-earnings signal
Deepest set of options strategy screeners in this comparison
Free tier is unusually feature-rich
Support via email, live chat, YouTube tutorials, and weekly webinars
Limitations
$99/month is steep if options aren't part of your workflow
Download caps can pinch heavy data users
Best for: Options traders structuring positions around earnings volatility events.
6. Earnings Hub
Earnings Hub is a mobile-first, AI-forward platform built around three ideas: fast alerts, condensed earnings calls, and a clean cross-asset calendar. Alongside the earnings calendar it also runs economic, dividend, and IPO calendars, which lets users track earnings dates in the same interface as Fed decisions or ex-dividend dates. AI call summaries condense hour-long CEO calls into highlights, guidance, and outlook, and alerts land via SMS, email, and push — SMS in particular is rare among competitors. The mobile app is rated 4.9 stars with over 3,000 reviews, and a permanently free tier makes it accessible to casual investors who don't want to commit to a subscription up front.
Core capabilities
Day, week, and month calendar views with release time, EPS, revenue, and current price
Actuals-vs.-estimates comparison in the schedule
Historical quarterly revenue and EPS trends for thousands of tickers
AI earnings call summaries condensing calls into highlights, guidance, and outlook
Live earnings calls plus archived replay
Full transcripts with searchable timestamp jumps
Instant alerts via SMS, email, and mobile push for releases, live calls, day-ahead schedule, and AI summaries
Economic calendar with Fed events, rate decisions, and consensus/actual/delta
Dividend calendar with ex-dividend tracking and watchlist filtering
IPO calendar with pricing and deal size
Mobile app rated 4.9 stars with 3,000+ reviews
Companion "The Buy Hold Rant" podcast and free Savvy Trader portfolio
Plans and pricing
Free — $0 permanent, calendar, basic ticker data, IPO feed, general earnings news
Monthly — $24.99/month with 3-day free trial, premium alerts, AI summaries, transcript translation, guidance data
Annual — $199.99/year (~$16.66/month), 33% savings vs. monthly, all premium features
Strengths
SMS alerts are rare in this category and land faster than email
AI summaries are among the most polished on this list
Highly rated mobile experience
Free tier is genuinely usable for casual investors
Limitations
3-day trial is short compared to competitors
Minimal charting or options analytics
Best for: Mobile-first investors who want push notifications and AI-condensed calls without heavy chart work.
7. Stock Rover
Stock Rover is a fundamental research and portfolio analytics platform where the earnings calendar is treated as one input inside a much larger screening and portfolio-tracking workflow. Instead of showing the entire market, its calendar can be scoped to the full universe, a specific watchlist, or an imported portfolio via Brokerage Connect — useful for investors who mostly care about earnings from names they already own. The platform pairs this with proprietary stock ratings across growth, valuation, efficiency, financial strength, dividends, and momentum, plus rebalancing tools, dividend income forecasting, and future portfolio simulations. Pricing scales up to an Ultimate Pro tier with 800+ metrics, and biennial billing offers roughly 40% savings for long-term users.
Core capabilities
Earnings calendar scoped to the full universe, portfolios, watchlists, or quotes lists
Day, week, and month views, sortable alphabetically or by market cap
Current-quarter EPS estimate plus prior-quarter result, with "on time" or "running late" status flags
Advanced screeners with importable library and equation-based filters
Spreadsheet-like table for multi-ticker comparison
Brokerage Connect for automatic portfolio sync
Portfolio analytics: value over time, risk/reward, monthly and annual returns
Future dividend income forecasting
Future simulations for portfolio outcome probability
Rebalancing tools with drift tolerance
Stock ratings across growth, valuation, efficiency, financial strength, dividends, and momentum
Plans and pricing
Free — Basic calendar and research
Premium — $34/month monthly, $29/month annual ($348/year), $24/month biennial
Premium Plus — $70/month monthly, $49/month annual ($588/year), $42/month biennial
Ultimate — $99/month monthly, $79/month annual ($948/year), $69/month biennial
Ultimate Pro — $199/month monthly, $149/month annual, $129/month biennial
14-day free trial with no credit card required. Note: no refunds after payment.
Strengths
Earnings calendar is tightly integrated with portfolios and watchlists
Screening depth reaches 800+ metrics on Ultimate
Biennial pricing offers up to ~40% savings
Ratings system provides quick fundamental context around earnings dates
Limitations
No-refund policy is stricter than most competitors
If a subscription lapses, saved watchlists, screeners, and notes are locked until re-subscription
Best for: Fundamental investors managing multi-position portfolios who want earnings dates tied directly to their holdings.
8. Option Alpha
Option Alpha is a no-code options automation and backtesting platform where the "Earnings Edge" module is engineered specifically for traders positioning around earnings releases. The flagship feature simulates identical entries before each earnings release over the past 5 years and holds each to end-of-week expiration, letting users see how a defined-risk strategy would have performed across dozens of prior cycles. Around that, the platform layers no-code automation bots, a 0DTE Oracle for zero-day-to-expiration setups, and continuous trade-idea scanning between 9:35 AM and 3:55 PM ET. Free paper trading works without a broker link, and broker-promo plans can bring the platform cost down to $0 when paired with a funded Tradier or TradeStation account.
Core capabilities
Earnings Edge: 5-year historical backtesting simulating identical entries before each earnings release, held to end-of-week expiration
Configurable position metrics: OTM %, premium, spread width, max loss cap
Actual post-earnings moves compared to market-implied moves (via ATM straddle IV)
Filters for conservative high-win-rate or high-variance strategies
Trade Ideas: continuous scan (9:35 AM–3:55 PM ET) using reward/risk, expected value, and Alpha (EV / max loss)
No-code automation bots for 24/7 execution
0DTE Oracle for intraday zero-day-to-expiration setups
Exit Options with trailing profit stops
Payoff diagrams, webhooks (e.g., TradingView integration), SmartPricing execution
Free paper trading with no broker linking required
Plans and pricing
Pro — $99/month annual, $149/month monthly; works with any supported broker, no minimum funding
Tradier Promo — $0/month, requires Tradier account, $5,000 initial deposit, $3,000 minimum balance
TradeStation Promo — $0/month, requires TradeStation account, $10,000 minimum balance
All plans: 50 active bots, $100k per bot, unlimited backtesting
30-day full-feature trial, 7-day refund window on annual after auto-renewal
2% of subscription revenue donated to charity: water
Promotional discounts up to 72% off during July 4th and Cyber Monday
Strengths
5-year earnings position backtesting is unique in this comparison
Bot automation removes emotional trading around earnings
Free paper trading with no broker link required
Broker-promo plans can bring platform cost to $0
Limitations
Not available for Canadian traders (backtesting and paper trading only)
Retail-only — professional subscribers not accepted
Heavier learning curve than a plain calendar tool
Best for: Retail options traders who want to build, backtest, and automate earnings-driven strategies.
9. MacroMicro
MacroMicro pairs a U.S. equity earnings database with global macro research and an AI assistant that launched in July 2026. The earnings side covers 5,000+ listed U.S. companies with competitive benchmarking, peer analysis, and quick screens for S&P 500, Nasdaq 100, Dow Jones 30, U.S. Sector Leaders, the M7 tech giants, and semiconductor leaders. What sets it apart from pure earnings tools is the macro overlay: users get unlimited macro charts, custom dashboards, an economic calendar that syncs with Google or Apple Calendar, and MM AI Chat plus an AI Dashboard for financial and macro Q&A. Both paid tiers are ad-free, and the Max AI annual plan includes a lifetime price lock — a meaningful hedge given the platform has flagged that Max AI pricing is expected to rise.
Core capabilities
U.S. Earnings Database covering 5,000+ listed companies
Competitive benchmarking, peer analysis, AI-powered earnings call module
Quick screens for S&P 500, Nasdaq 100, Dow Jones 30, U.S. Sector Leaders, M7 Tech Giants, Semiconductor Giants
Data tables and charts for price, market cap, D/W/M/YTD returns, P/E, P/B
Multi-ticker return comparison (e.g., NVDA vs. AAPL vs. GOOG vs. GOOGL)
MM AI Chat and AI Dashboard for financial and macro Q&A
Unlimited macro charts, exclusive reports, custom dashboards
Global economic calendar sync with Google/Apple
Plans and pricing
Prime — $25/month monthly, $20.95/month annual (~17% savings)
Max AI — $30/month monthly, $24.95/month annual (~20% savings, price expected to rise)
The full earnings database, sector hubs, and unlimited AI features are gated behind Max AI (annual). Max AI annual includes a 2026 Economic Outlook Report (valued at $240) and a lifetime price lock.
Strengths
5,000-company U.S. coverage is substantial for the price
AI Chat + AI Dashboard combo is unusual at this tier
Ad-free on both paid tiers
Lifetime price lock on Max AI annual is a genuine long-term hedge
Limitations
Prime tier restricts earnings database access significantly
No free tier — a subscription is required to explore
Coverage is U.S.-centric
Best for: Investors who want macro context alongside U.S. earnings data and who value AI-driven Q&A.
10. Estimize
Estimize takes a fundamentally different approach from every other platform on this list: instead of relying on sell-side consensus, it crowdsources earnings estimates from a mix of buy-side, sell-side, independent, academic, and amateur contributors. The dataset has documented statistical edge — its crowdsourced consensus has historically been closer to actuals than sell-side consensus about 70% of the time, and it collects roughly 2× the estimate depth per release with 3× the revision frequency of traditional channels, backed by more than a dozen academic papers. On top of the consensus, Estimize offers 10+ years of historical estimate data, KPI tracking on select tickers (same-store sales, MAU, product segment revenue), and API access for quantitative users. Free access is real, but it operates on a give-and-take model — you have to contribute your own estimates to unlock data on those tickers.
Core capabilities
Crowdsourced consensus closer to actuals than sell-side ~70% of the time
Per-release estimate depth roughly 2× traditional channels, with 3× more revision frequency
10+ years of historical estimate data, validated by more than a dozen academic papers
Give-and-take model: contribute estimates to unlock free data on those tickers
KPI tracking on select tickers: same-store sales, MAU, product segment revenue
Algorithmic filtering of invalid estimates
Proprietary Selected Consensus Model for weighting
Anonymous contribution option for compliance-sensitive users
Leaderboards, user profiles, advanced screeners, daily email alerts
Plans and pricing
Contributor — $0/month, access only to tickers you've estimated on
Premium — $99/month, unblinded access, daily Excel export, factor models
Premium Plus — $249/month, adds API access and premium support, free trial available on request
Institutional — Custom quote, adds FTP access and raw data feeds
Strengths
Consensus data has documented statistical edge over sell-side-only estimates
Free tier is real if you're willing to contribute
API access enables quantitative workflows
Long academic validation history
Limitations
Free access is limited to tickers you personally estimate
Premium starts at $99/month with no lower paid tier
It's a data source, not a full calendar workspace
Best for: Quantitatively inclined investors who want an alternative consensus dataset with documented edge over sell-side numbers.
Key Takeaways
Transcript-focused research is best served by Earnings Calendar, Earnings Report, and Earnings Hub — each offers AI summaries or translation and structured note-taking workflows.
Options traders benefit most from Market Chameleon (implied moves, strategy screeners) and Option Alpha (5-year backtesting, bot automation).
Global coverage is deepest at Koyfin (~100,000 stocks), with TradingView close behind on multi-calendar integration.
Portfolio-integrated tracking is a strength of Stock Rover and Koyfin, both of which can filter earnings by watchlist or portfolio.
Alternative data is Estimize's niche — no other platform on this list offers crowdsourced consensus.
Free tiers vary widely — TradingView, Market Chameleon, Earnings Hub, Earnings Calendar, and Earnings Report all offer usable free access; MacroMicro and Estimize Premium do not.
Refund policies differ: Koyfin offers 30 days, TradingView 14 days on annual only, Stock Rover none, and Option Alpha 7 days after annual auto-renewal.
Conclusion
There is no single best earnings calendar platform — the right choice depends on how you actually use earnings data. Chart-driven traders, options specialists, transcript-focused researchers, and long-term fundamental investors each have platforms clearly tuned to their workflows. Pricing spans from permanent free tiers to $299/month advisor products, and most paid tools offer trials long enough to test before committing.
A practical approach is to list your top three use cases — for example, "translate international transcripts," "screen straddles into earnings," or "sync earnings dates to my portfolio" — and match them to the two or three platforms that solve those problems directly. For most individual investors, one paid platform paired with one strong free tier covers the ground without duplication.
HOW DO YOU FEEL ABOUT FASHION?
COMMENT OR TAKE OUR PAGE READER SURVEY
Featured





Discover the biological, sensory, and psychological reasons why kids prefer sweet foods over vegetables.