
The Percentage Lies, the Volume Doesn't: What Prediction Markets Teach You About Reading Conversion Data

PAGE
By PAGE Editor
Every performance marketer has made the same mistake. A landing page shows a 12 percent conversion rate, it goes into the report, and nobody checks that it ran on 40 visitors.
Prediction markets make that error visible in a way analytics dashboards never do, because they publish the percentage and the volume side by side. Looking at a live board is a useful exercise in reading data you cannot fully trust.
Here is what one afternoon on a tennis board showed.

Tennis Board Snapshot, Fanatics Markets
Maxime Janvier 12% / Yanis Durand 90%, $17k volume, the deepest on the board
Pedro Martinez 99% / Francesco Forti 1%, $13k volume
Tiago Pereira / Marco Trungelliti 82%, $9k volume
Maximo Zeitune 49% / A. Meza 52%, $9k volume
Rositsa Dencheva 63% / Ipek Oz 36%, $7k volume
The 99 percent market
Pedro Martinez vs Francesco Forti, scheduled for 16:30, carried the most extreme pricing on the board.
Martinez was implied at 99 percent, Forti at 1 percent. A $100 position on Martinez showed a $101 return. The same position on Forti showed $10,000.
That is a 100 to 1 payout ratio, and it sat on $13,000 of volume, second-deepest on the visible board. Consensus this complete usually arrives on thin books, because there is little reason to take either side. Here it did not.
This is where the parallel starts. A market priced at 99 percent on $13,000 and one priced at 99 percent on $200 are not the same claim, but they render identically as a number. The same is true of a 12 percent conversion rate on 40 sessions and one on 40,000.
Performance marketing reporting rarely shows both figures with equal prominence. Prediction markets do, and the habit of reading them together transfers directly.
When the crowd disagrees with the confidence interval
The marketing equivalent is a channel that looks certain on small numbers. Confidence and sample size move independently, and a dashboard showing only the first invites the wrong conclusion.
Maxime Janvier vs Yanis Durand took $17,000, more volume than any other tennis market on screen, at 12 percent to 90 percent in the third set.
By contrast, Maximo Zeitune vs A. Meza was priced at 49 percent to 52 percent, a three-point gap and the tightest market on the board. It drew $9,000, roughly half of Janvier and Durand.
Why that runs against the usual pattern. Participation tends to follow uncertainty, because a market that has settled offers less reason to take a position. On Monday's board the money went the other way, toward matches already in progress with a clear leader.
One plausible reading is set state. Janvier and Durand, Pereira and Trungelliti, and Sanchez Izquierdo and Rodriguez Tavares were all live and into the third set. Live markets with a decided direction still attract activity as the remaining probability compresses.
There is a version of this on the court too. Elite athletes talk about finding incremental advantages that change an outcome, and a match that looks settled on the scoreboard rarely feels settled to the player behind. The market pricing a third set at 12 percent is describing probability, not certainty.
Against Friday's board
The comparison is where this gets interesting, because both figures come from captures four days apart.
Friday, 4 September. Twelve visible markets carrying roughly $183,000, with two matches taking about four fifths of it. Thiago Seyboth Wild vs Juan Pablo Varillas alone held $98,000.
Monday, 8 September. Twelve visible markets carrying roughly $79,000, with the top three accounting for close to half.
Two changes, and they point in different directions.
Total volume fell sharply, to roughly 43 percent of Friday's level across the same number of visible markets.
Concentration loosened. Friday had one dominant market absorbing more than half the board. Monday's deepest took 22 percent, and the money spread across more names.
A board with no single dominant market behaves differently. On Friday, one match set the tone and everything else was a footnote. On Monday there were four markets above $7,000, which gives a reader more than one place to look and makes the thin markets easier to identify by contrast.
The payout ratios worth noting
Implied percentage and payout are the same information expressed two ways, and the second is often easier to read.
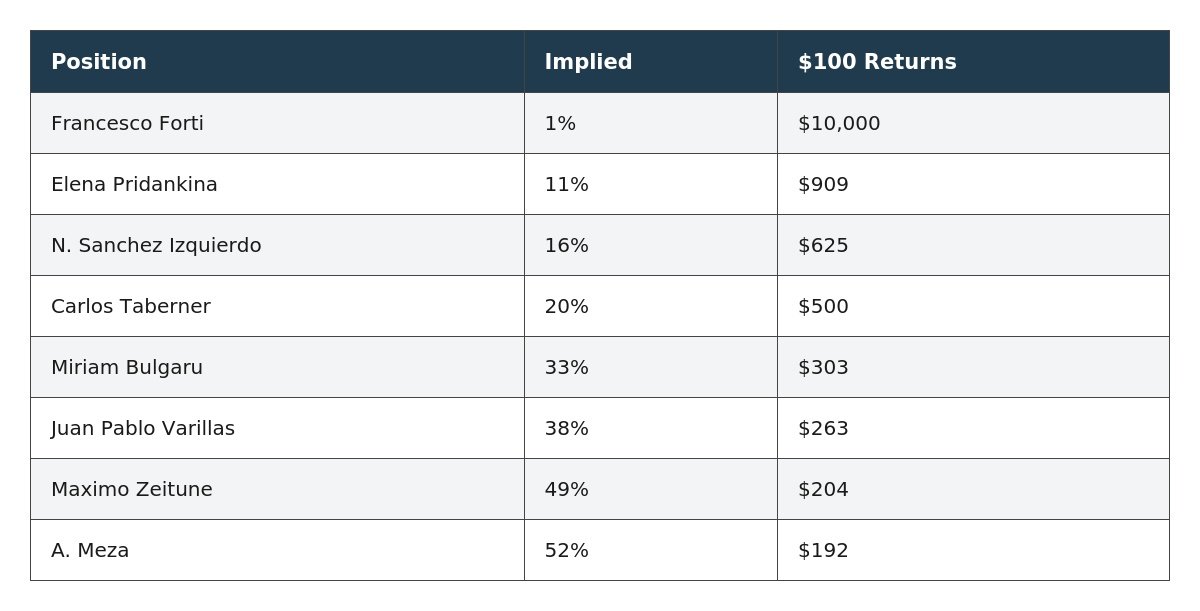
Read the bottom of that table rather than the top. Zeitune and Meza at $204 and $192 describe a market that has genuinely not decided. Forti at $10,000 describes one that has, and the payout size reflects how firmly.
Where the board sat overall
The visible screen carried roughly $79,000 across twelve markets, with the top three accounting for close to half of it.
Rositsa Dencheva vs Ipek Oz sat at 63 to 36 on $7,000. Miriam Bulgaru vs Federica Urgesi at 33 to 68 on $5,000. Henrique Rocha vs Carlos Taberner at 81 to 20 on $5,000.
At the thinner end, Ane Mintegi Del Campo vs Elena Pridankina showed 90 to 11 on $2,000, with a Pridankina position returning $909. The featured market, Enzo Aguiard vs Khumoun Sultanov, was priced at 37 to 70 ahead of a 14:20 start on just $2,000.
Juan Pablo Varillas appeared again after featuring in last week's deepest tennis market. This time he was on the wrong side of the price, at 38 percent against Federico Arnaboldi at 63 percent, on $3,000.
One market priced below 100
Reading down the board, most pairs sum slightly above 100, which reflects the spread between the two sides of a two-way market.
Aguiard and Sultanov summed to 107. Sanchez Izquierdo and Rodriguez Tavares to 105. Most others landed on 101 or 102. Martinez and Forti summed to exactly 100.
Dencheva and Ipek Oz summed to 99, below the pair total, which is uncommon and worth noting for anyone tracking spread behaviour across a session.
What that gap means in practice
The sum above 100 is the two-sided spread, and it varies with liquidity rather than holding constant.
For anyone comparing a market price against their own read, the size of that gap forms part of the calculation. The latest tennis betting odds update continuously through each session, so the figures above describe one moment rather than a settled position.
The wider board
Tennis sat alongside a live US Open collection and markets across soccer, baseball, football, golf, esports, basketball, motorsports, hockey and sailing, plus non-sports categories covering crypto, politics, culture and the economy.
Twenty-one markets were listed as live across the platform at the time of the snapshot.
How these markets work
Contracts on Fanatics Markets are event contracts rather than fixed quotes. Prices move continuously as participants take positions, and the displayed percentage reflects what the market currently implies rather than a figure set by the platform.
Morton St. Trading Investments, LLC, doing business as Fanatics Markets, is a CFTC-registered futures commission merchant and NFA member. Contracts are offered by Fanatics Markets through Crypto.com | Derivatives North America.

Before you follow these markets
Trading event contracts involves significant risk and is not appropriate for everyone. Participants risk losing the cost of entering a transaction, including fees, and should consider whether event contracts suit their circumstances and experience. Past performance is not necessarily indicative of future results.
Eligibility requirements apply, availability varies by state, and participants must be US residents aged 21 or over.
No event contract is endorsed by any sports league, association or individual participant, and use of a name does not indicate endorsement. Live market data may be delayed or incorrect and is provided for informational purposes only.
Three habits worth stealing
Publish the denominator. Any percentage in a report should carry the sample it came from, in the same line rather than a footnote.
Treat thin data as provisional. A 20 percent conversion rate on 25 sessions is a hypothesis, not a result. Prediction markets price thin books wide for the same reason.
Compare the same period twice. Friday's board carried $183,000 across twelve markets. Monday's carried $79,000 across twelve. Same structure, entirely different confidence, and you would only know by checking both.
Board data captured 8 September 2026. Prices move continuously and will have changed since publication.
HOW DO YOU FEEL ABOUT FASHION?
COMMENT OR TAKE OUR PAGE READER SURVEY
Featured




Twelve times on input and twelve times on output is not a ratio you usually find inside a single vendor's lineup.